- Docker - Home
- Docker - Overview
- Docker - Installing on Linux
- Docker - Installation
- Docker - Hub
- Docker - Images
- Docker - Containers
- Docker - Registries
- Docker - Compose
- Docker - Working With Containers
- Docker - Architecture
- Docker - Layers
- Docker - Container & Hosts
- Docker - Configuration
- Docker - Containers & Shells
- Docker - Dockerfile
- Docker - Building Files
- Docker - Public Repositories
- Docker - Managing Ports
- Docker - Web Server
- Docker - Commands
- Docker - Container Linking
- Docker - Data Storage
- Docker - Volumes
- Docker - Networking
- Docker - Security
- Docker - Toolbox
- Docker - Cloud
- Docker - Build Cloud
- Docker - Logging
- Docker - Continuous Integration
- Docker - Kubernetes Architecture
- Docker - Working of Kubernetes
- Docker - Generative AI
- Docker - Hosting
- Docker - Best Practices
- Docker - Setting Node.js
- Docker - Setting MongoDB
- Docker - Setting NGINX
- Docker - Setting ASP.Net
- Docker - Setting MySQL
- Docker - Setting Go
- Docker - Setting Rust
- Docker - Setting Apache
- Docker - Setting MariaDB
- Docker - Setting Jupyter
- Docker - Setting Portainer
- Docker - Setting Rstudio
- Docker - Setting Plex
- Docker Setting - Flame
- Docker Setting - PostgreSql
- Docker Setting - Mosquitto
- Docker Setting - Grafana
- Docker Setting - Nextcloud
- Docker Setting - Pawns
- Docker Setting - Ubuntu
- Docker Setting - RabbitMQ
- Docker - Setting Python
- Docker - Setting Java
- Docker - Setting Redis
- Docker - Setting Alpine
- Docker - Setting BusyBox
- Docker Setting - Traefik
- Docker Setting - WordPress
- Docker Useful Resources
- Docker - Quick Guide
- Docker - Useful Resources
- Docker - Discussion
Docker - Setting Grafana
Grafana is an open-source data visualization platform that helps users monitor, visualize, and analyze data to create interactive dashboards.
Grafana displays real-time metrics which can also be queried, doesnt matter where your information or data is stored. However, setting up Grafana for different environments can be challenging due to system-specific challenges and dependencies.
This chapter will walk you through how to solve this problem by setting up Grafana with Docker to containerize your Grafana instance and easily manage it across different development and production environments.
Two Editions of Grafana Docker Image
There are mainly two editions of Grafana Docker Image −
- Grafana OSS − Grafana OSS is an Open Source Option, free of cost. It allows users to make custom dashboards, query data, and even set up alerts. Grafana OSS is best for users who have small to medium teams.
- Grafana Enterprise − Grafana Enterprise is a paid version that comes with all the features of Grafana OSS along with some advanced features like security and protection and better teamwork tools. It is best for users who are dealing with complex data and require advanced security and protection.
In this chapter, we will be discussing how to set up Grafana OSS.
Prerequisites for Dockerizing Grafana
Before starting, ensure you have the following prerequisites −
- Basic Knowledge of Docker − Basic knowledge of Docker like containers, images, and docker files will make it easier for you to understand this guide.
- Grafana Basics − Basic knowledge of Grafanas functionality, such as creating dashboards, connecting data sources, and exploring its UI is recommended.
- Docker Installed − Make sure Docker is installed on your machine. You can download it from Docker's official website.
- Docker Compose − Make sure you have Docker Compose installed on your machine if you are setting up Graffana through Docker Compose.
- Command Line Interface (CLI) − You should be comfortable with CLI for executing commands.
You can run a Grafana container either using Docker CLI or Docker Compose. In this chapter, we will be going through both of these methods.
Run Grafana Container - Docker CLI
This section is about how you can dockerize your Grafana container through a command line interface or CLI.
If you are using a LINUX machine (Ubuntu or Debian-based systems), you might need to add sudo before these commands to provide admin privileges.
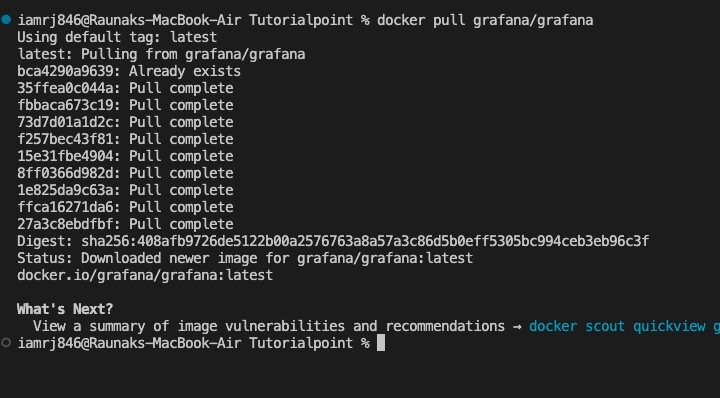
Step 1: Pull the Grafana Docker Image
Before running a Grafana container, you need to pull a Grafana Docker Image.
$ docker pull grafana/grafana
Step 2: Run Grafana Container
$ docker run -d -p 3000:3000 --name=grafana grafana/grafana
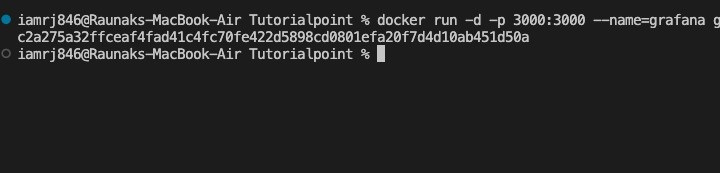
Where,
- -d = represents the detached mode.
- -p 3000:3000 = mapping of your localhost port (3000) to the Grafana containers port (3000).
- --name=grafana = represents the name of your container.
- grafana/grafana = image name you want to run.
Step 3: Save your Data (optional)
Grafana uses SQLite version 3 database by default to store all the data. But this data is only stored as long as your container exists. Once you delete your container, all the data like users, dashboards, and configurations will be lost. To save your data even after deleting the container, you can use Docker volumes.
Using Docker volumes would allow you to fully control, manage, and access your data using Docker CLI.
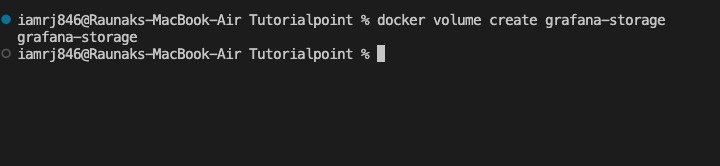
First, you need to create a Docker volume. You can name it anything but we will name it grafana-storage in this example.
$ docker volume create grafana-storage
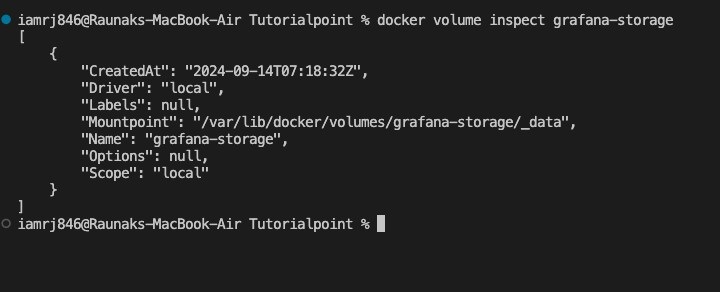
You can verify if your Docker volume is generated correctly by running the following command. If your volume is created, this command will give you some JSON output.
$ docker volume inspect grafana-storage
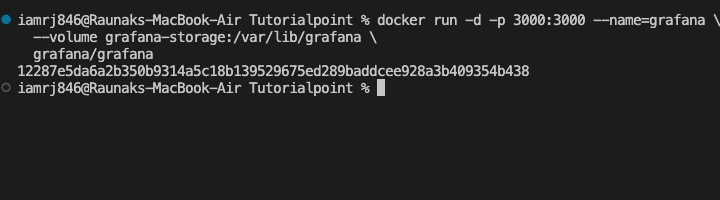
After creating the Docker volume which will be used by your Grafana container, you need to run your Grafana container.
$ docker run -d -p 3000:3000 --name=grafana \
  --volume grafana-storage:/var/lib/grafana \
  grafana/grafana
Step 4: Stop Your Container
To stop the container, run the following command −
$ docker stop grafana

Here, grafana is the name of your container.
Run Grafana Container Docker Compose
You can also run a Grafana container through Docker Compose. Docker Compose is a tool or software that allows you to define and run multi-container applications. It requires a YAML file (for example, docker-compose.yaml) where you can list down all the configurations of the services that make up your application.
All the containers can be started sequentially by just one command and can be stopped in the same way.
Step 1: Install Docker Compose
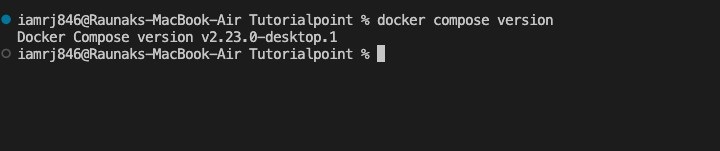
To run a Grafana container via Docker, you need to install Docker Compose on your machine. You can verify if it is installed correctly using the following command.
$ docker compose version
You will get the Docker Compose version if it is installed perfectly otherwise you will get an error.
Step 2: Create .yaml file
After installation, create a docker-compose.yaml file. This file will include all the configuration of the services required to make up your application.
Do not create this file in the root directory. Move to your docker-compose directory and create this file in that directory.
$ touch docker-compose.yaml
Step 3: Populate .yaml file
Add the following configuration to your docker-compose.yaml file.
version: '3'
services:
  grafana:
    image: grafana/grafana
    container_name: grafana
    ports:
      - "3000:3000"
Step 4: Save Your Data
To save your data so that you dont lose your configurations, dashboards, user, etc. when you delete your container, you can use Docker volumes.
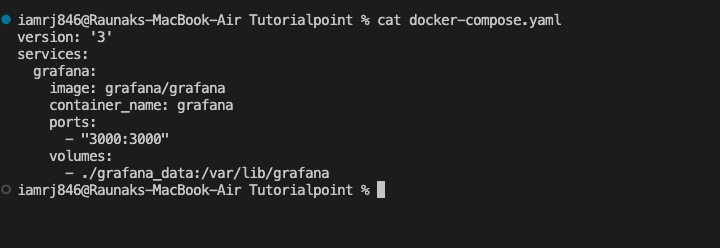
You have to make some changes in your docker-compose.yaml file to use docker volumes. Replace the existing code with the following code in the docker-compose.yaml file.
version: '3'
services:
  grafana:
    image: grafana/grafana
    container_name: grafana
    ports:
      - "3000:3000"
    volumes:
      - ./grafana_data:/var/lib/grafana
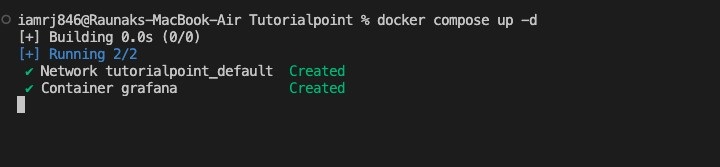
Step 5: Run docker-compose.yaml file
To run your docker-compose.yaml file, run the following command.
$ docker compose up -d
Where,
- d = d flag represents the detached mode
- up = up is for the container to run
Step 6: Access Grafana Dashboard
You can visit https://localhost:3000 in your browser to access the Grafana dashboard.
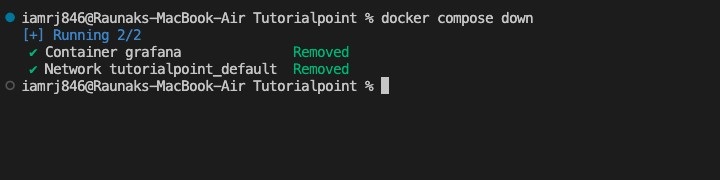
Step 7: Stop Grafana Container
To stop your Grafana container, run the following command −
$ docker compose down
Conclusion
You have successfully set up Grafana with Docker and ran your Grafana container inside Docker via both CLI and Docker compose. This way, you can use Grafana in different environments easily without caring much about different systems and dependency issues. Using Docker volume to store your Grafana data ensures that you dont lose any of your data even after deleting your instance and allows the Docker engine to fully manage and access the storage.
FAQs on Setting Grafana with Docker
There are some very Frequently Asked Questions about Setting Grafana with docker, this section tries to answer them briefly.
1. How do I scale Grafana in a Docker environment?
You can scale Grafana for high availability by deploying multiple Grafana instances in Docker. Use a load balancer to share the load on the servers and for storing data like dashboards, configurations, users, etc. use a shared database like PostgreSQL.
2. How can I monitor the Grafana container?
You can monitor your Grafana container by using monitoring software like Prometheus which will allow you to keep track of your containers performance by tracking different metrics like CPU usage, memory utilization, and network usage. You can directly integrate it with Grafana to visualize these metrics on the dashboard.
3. What are the best security practices for using Grafana in Docker?
You can limit IP addresses/hostnames for data source URLs by customizing the Grafana configuration. Along with it, you can set up a proxy server so that all the requests go through a proxy server.
You can configure firewall restrictions as well to restrict network requests to suspicious web servers. On top of that, you can disable anonymous access in Grafana so that no user has the view access without authentication.