- SciPy - Home
- SciPy - Introduction
- SciPy - Environment Setup
- SciPy - Basic Functionality
- SciPy - Relationship with NumPy
- SciPy Clusters
- SciPy - Clusters
- SciPy - Hierarchical Clustering
- SciPy - K-means Clustering
- SciPy - Distance Metrics
- SciPy Constants
- SciPy - Constants
- SciPy - Mathematical Constants
- SciPy - Physical Constants
- SciPy - Unit Conversion
- SciPy - Astronomical Constants
- SciPy - Fourier Transforms
- SciPy - FFTpack
- SciPy - Discrete Fourier Transform (DFT)
- SciPy - Fast Fourier Transform (FFT)
- SciPy Integration Equations
- SciPy - Integrate Module
- SciPy - Single Integration
- SciPy - Double Integration
- SciPy - Triple Integration
- SciPy - Multiple Integration
- SciPy Differential Equations
- SciPy - Differential Equations
- SciPy - Integration of Stochastic Differential Equations
- SciPy - Integration of Ordinary Differential Equations
- SciPy - Discontinuous Functions
- SciPy - Oscillatory Functions
- SciPy - Partial Differential Equations
- SciPy Interpolation
- SciPy - Interpolate
- SciPy - Linear 1-D Interpolation
- SciPy - Polynomial 1-D Interpolation
- SciPy - Spline 1-D Interpolation
- SciPy - Grid Data Multi-Dimensional Interpolation
- SciPy - RBF Multi-Dimensional Interpolation
- SciPy - Polynomial & Spline Interpolation
- SciPy Curve Fitting
- SciPy - Curve Fitting
- SciPy - Linear Curve Fitting
- SciPy - Non-Linear Curve Fitting
- SciPy - Input & Output
- SciPy - Input & Output
- SciPy - Reading & Writing Files
- SciPy - Working with Different File Formats
- SciPy - Efficient Data Storage with HDF5
- SciPy - Data Serialization
- SciPy Linear Algebra
- SciPy - Linalg
- SciPy - Matrix Creation & Basic Operations
- SciPy - Matrix LU Decomposition
- SciPy - Matrix QU Decomposition
- SciPy - Singular Value Decomposition
- SciPy - Cholesky Decomposition
- SciPy - Solving Linear Systems
- SciPy - Eigenvalues & Eigenvectors
- SciPy Image Processing
- SciPy - Ndimage
- SciPy - Reading & Writing Images
- SciPy - Image Transformation
- SciPy - Filtering & Edge Detection
- SciPy - Top Hat Filters
- SciPy - Morphological Filters
- SciPy - Low Pass Filters
- SciPy - High Pass Filters
- SciPy - Bilateral Filter
- SciPy - Median Filter
- SciPy - Non - Linear Filters in Image Processing
- SciPy - High Boost Filter
- SciPy - Laplacian Filter
- SciPy - Morphological Operations
- SciPy - Image Segmentation
- SciPy - Thresholding in Image Segmentation
- SciPy - Region-Based Segmentation
- SciPy - Connected Component Labeling
- SciPy Optimize
- SciPy - Optimize
- SciPy - Special Matrices & Functions
- SciPy - Unconstrained Optimization
- SciPy - Constrained Optimization
- SciPy - Matrix Norms
- SciPy - Sparse Matrix
- SciPy - Frobenius Norm
- SciPy - Spectral Norm
- SciPy Condition Numbers
- SciPy - Condition Numbers
- SciPy - Linear Least Squares
- SciPy - Non-Linear Least Squares
- SciPy - Finding Roots of Scalar Functions
- SciPy - Finding Roots of Multivariate Functions
- SciPy - Signal Processing
- SciPy - Signal Filtering & Smoothing
- SciPy - Short-Time Fourier Transform
- SciPy - Wavelet Transform
- SciPy - Continuous Wavelet Transform
- SciPy - Discrete Wavelet Transform
- SciPy - Wavelet Packet Transform
- SciPy - Multi-Resolution Analysis
- SciPy - Stationary Wavelet Transform
- SciPy - Statistical Functions
- SciPy - Stats
- SciPy - Descriptive Statistics
- SciPy - Continuous Probability Distributions
- SciPy - Discrete Probability Distributions
- SciPy - Statistical Tests & Inference
- SciPy - Generating Random Samples
- SciPy - Kaplan-Meier Estimator Survival Analysis
- SciPy - Cox Proportional Hazards Model Survival Analysis
- SciPy Spatial Data
- SciPy - Spatial
- SciPy - Special Functions
- SciPy - Special Package
- SciPy Advanced Topics
- SciPy - CSGraph
- SciPy - ODR
- SciPy Useful Resources
- SciPy - Reference
- SciPy - Quick Guide
- SciPy - Cheatsheet
- SciPy - Useful Resources
- SciPy - Discussion
SciPy - Clusters
What is SciPy Clustering?
In SciPy Clustering refers to the process of grouping a set of data points into clusters based on their similarities or distances from one another.
The goal of clustering is to partition the data into subsets where data points within each subset are more similar to each other than to those in other subsets. SciPy provides a range of clustering algorithms within its scipy.cluster module to perform this task.
Types of SciPy Clusters
SciPy offers a variety of clustering techniques through its scipy.cluster module. Below is the image which shows types of clusters in SciPy −
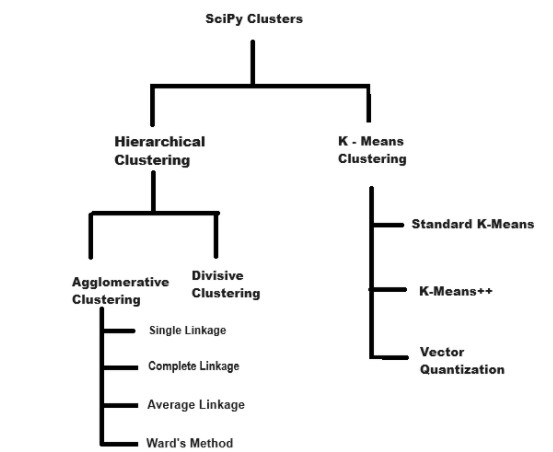
Here's a detailed overview of the clustering methods available −
Hierarchical Clustering
Hierarchical clustering is a method of cluster analysis that seeks to build a hierarchy of clusters. This approach can be visualized as a tree structure known as a dendrogram.
In hierarchical clustering the data is grouped either by successively merging smaller clusters into larger ones i.e. agglomerative or by splitting a large cluster into smaller ones i.e. divisive.
Following are the different types of Scipy Hierarchical Clustering −
Agglomerative Hierarchical Clustering
Agglomerative Hierarchical Clustering is a widely-used clustering technique that builds a hierarchy of clusters by progressively merging the closest clusters.
This approach is a bottom-up method which means it starts with each data point as its own cluster and then merges clusters step by step until all data points are grouped into a single cluster. The process is visualized using a dendrogram, a tree-like structure that represents the merging steps.
In Python the scipy.cluster.hierarchy module provides the linkage function to perform agglomerative hierarchical clustering. This function is versatile and allows for the use of various linkage methods each of which defines a different criterion for merging clusters.
The choice of linkage method affects how the distances between clusters are calculated and consequently, how clusters are merged. Let's see the different linkage methods available in SciPy Agglomerative Clustering−
Single Linkage
Single Linkage Clustering is a type of hierarchical clustering that is also known as the "minimum linkage" or "nearest neighbor" method. It is one of the simplest methods for agglomerative clustering.
The distance between two clusters is defined as the shortest distance between any single pair of points, where each point is from one of the two clusters. This method tends to produce long "chain-like" clusters and can be sensitive to noise.
Following is the mathematical formula given to calculate the distance −
d(A,B) = min{d(a,b):aA,bB}
Complete Linkage
Complete Linkage Clustering is a type of hierarchical clustering which is also known as "maximum linkage" or "farthest neighbor" method. It is an agglomerative clustering technique where the distance between two clusters is defined as the maximum distance between any single point in one cluster and any single point in the other cluster.
Here is the mathematical formula to calculate the distance −
d(A,B) = max{d(a,b):aA,bB}
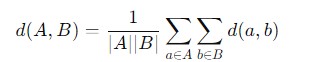
Average Linkage
Average Linkage Clustering is also known as the "UPGMA" (Unweighted Pair Group Method with Arithmetic Mean) or "group average" method which is another type of hierarchical clustering. In this method the distance between two clusters is defined as the average distance between all pairs of points where one point is from each cluster.
Here is the mathematical formula to calculate the distance of average linkage −
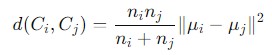
Ward Linkage
Ward linkage is a type of Agglomerative Clustering method used in hierarchical clustering to compute the distances between clusters based on the variance of their combined data points.
It is designed to minimize the total within-cluster variance or equivalently, to minimize the sum of squared differences within clusters. The mathematical formula to calculate the distance is given as follows −
Dendrogram
A dendrogram is a tree-like diagram that is used to illustrate the arrangement of clusters formed by hierarchical clustering. It visually represents the hierarchical relationships between clusters and helps to understand the data structure and clustering process.
Key Elements of a Dendrogram
The Key elements of the Dendrogram is given as follows −
- Leaves: Represent the individual data points or objects.
- Nodes: Represent clusters formed at each level of the hierarchy. The height of a node indicates the distance at which clusters are merged.
- Branches: Connect nodes and show the relationship between clusters at different levels.
Divisive Clustering
Divisive Clustering is also known as Top-Down Hierarchical Clustering which is a type of hierarchical clustering method that begins with all data points in a single cluster and then recursively splits the clusters into smaller clusters until each data point is its own cluster or a desired number of clusters is reached.
This is in contrast to agglomerative clustering which starts with each data point as its own cluster and merges them into larger clusters.
K - Means Clustering
K-means clustering is a popular and straightforward unsupervised machine learning algorithm used to partition a dataset into a set of distinct, non-overlapping groups (clusters).
It is particularly useful for tasks where we need to group similar data points together but the exact number of groups (clusters) is not known beforehand.
Key Concepts of K-means Clustering
Following are the key concepts of K - Means Clustering −
- Centroids: The K-means algorithm partitions the data into k clusters. Each cluster is represented by its centroid, which is the mean of all the data points within that cluster.
- Cluster: A cluster is a collection of data points grouped together because of their similarity to one another. Each cluster is represented by a centroid which is the mean of all points in the cluster.
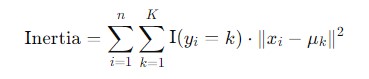
- Inertia: Inertia quantifies how tightly the data points are clustered around their centroids. It is the sum of the squared distances between each data point and the centroid of the cluster to which it belongs. Mathematically it's defined as −
Types of K-Means clustering
In SciPy the K-means clustering algorithm is primarily implemented through the scipy.cluster.vq module. Following are the different types of K-Means Clustering −
Standard K-Means Clustering
Standard K-Means Clustering is a widely used clustering algorithm that partitions a dataset into a specified number of clusters (K) by minimizing the variance within each cluster.
This is widely used in various applications such as customer segmentation, image compression and anomaly detection. However it is important to consider its limitations and possibly use more advanced variants or techniques depending on the specific data and clustering requirements.
Standard K-Means Clustering
K-Means++ is an enhancement of the standard K-means clustering algorithm designed to improve the initialization step. The primary goal of K-Means++ is to address the problem of poor clustering results due to suboptimal initial centroid placement which can occur with random initialization in the standard K-means algorithm.
SciPy Cluster Module
The cluster module provide the functionality related to cluster algorithm. Following are the methods of the SciPy Cluster −
| Sr.No. | Types & Description |
|---|---|
| 1 |
This method is a part of hierarchical algorithm which group the data points into a specified number of cluster. |
| 2 |
This method grouped the similar data into cluster. |
| 3 |
This method is used to identify the cluster center. |
| 4 |
This method works on hierarchical cluster which can be used to perform the task of linkage matrix. |
| 5 |
This method performs the task of single/minimum/nearest linkage on a condensed matrix. |
| 6 |
This Method perform the task of complete linkage(largest point) on a condensed distance matrix. |
| 7 |
This method is used to perform the task of arithmetic mean on a distance matrix. |
| 8 |
This method depends on other functions which user can perform such as weighted means, weighted sums, and weighted operations. |
| 9 |
This method define an one-dimensional array in which data values are calculated with the help of average weight and these weights itself represent a value. |
| 10 |
This method is used to find the median value of an array. |
| 11 |
This method is a part of agglomerative cluster which minimize the total cluster variance within its control. |
| 12 |
This method calculates the cophenetic distance between each observation of the hierarchical cluster. |
| 13 |
This method is used to work with clustering algorithm(mlab.linkage) and converts it into a format that can be used for the references of other SciPy clustering functions. |
| 14 |
This method is used to perform the calculation of inconsistency statistics on a linkage matrix. |
| 15 |
This method is used to calculate the distances between two datasets. |
| 16 |
This method calculate the pairwise distances between the points from the given set. |
| 17 |
This method perform the task of maximum value obtained by a column R for each non-singleton cluster and its children. |
| 18 |
This method is used to convert the clustering output into MATLAB compatible format. |
| 19 |
This method determine its functionality by cutting clusters at a particular height. |
| 20 |
This method perform the task of matplotlib color codes while representing different level of clusters. |
| 21 |
This method is used to manage the data partition set into a disjoint subsets. |
Representing Hierarchies as Tree Objects
SciPy offers functions for managing hierarchical clustering trees, allowing you to group data into clusters based on their similarities. These functions help you visualize, reorganize, and retrieve clusters from hierarchical tree structures.
| Sr.No. | Function & Description |
|---|---|
| 1 |
This method represents a node in a hierarchical clustering tree. |
| 2 |
This method reorders the leaves to minimize the distance between adjacent clusters. |
| 3 |
This method returns the leaf node order in a hierarchical clustering tree. |
| 4 |
This method converts a linkage matrix into a tree object. |
| 5 |
This method extracts cluster memberships by cutting the hierarchical tree at a given depth. |