- SciPy - Home
- SciPy - Introduction
- SciPy - Environment Setup
- SciPy - Basic Functionality
- SciPy - Relationship with NumPy
- SciPy Clusters
- SciPy - Clusters
- SciPy - Hierarchical Clustering
- SciPy - K-means Clustering
- SciPy - Distance Metrics
- SciPy Constants
- SciPy - Constants
- SciPy - Mathematical Constants
- SciPy - Physical Constants
- SciPy - Unit Conversion
- SciPy - Astronomical Constants
- SciPy - Fourier Transforms
- SciPy - FFTpack
- SciPy - Discrete Fourier Transform (DFT)
- SciPy - Fast Fourier Transform (FFT)
- SciPy Integration Equations
- SciPy - Integrate Module
- SciPy - Single Integration
- SciPy - Double Integration
- SciPy - Triple Integration
- SciPy - Multiple Integration
- SciPy Differential Equations
- SciPy - Differential Equations
- SciPy - Integration of Stochastic Differential Equations
- SciPy - Integration of Ordinary Differential Equations
- SciPy - Discontinuous Functions
- SciPy - Oscillatory Functions
- SciPy - Partial Differential Equations
- SciPy Interpolation
- SciPy - Interpolate
- SciPy - Linear 1-D Interpolation
- SciPy - Polynomial 1-D Interpolation
- SciPy - Spline 1-D Interpolation
- SciPy - Grid Data Multi-Dimensional Interpolation
- SciPy - RBF Multi-Dimensional Interpolation
- SciPy - Polynomial & Spline Interpolation
- SciPy Curve Fitting
- SciPy - Curve Fitting
- SciPy - Linear Curve Fitting
- SciPy - Non-Linear Curve Fitting
- SciPy - Input & Output
- SciPy - Input & Output
- SciPy - Reading & Writing Files
- SciPy - Working with Different File Formats
- SciPy - Efficient Data Storage with HDF5
- SciPy - Data Serialization
- SciPy Linear Algebra
- SciPy - Linalg
- SciPy - Matrix Creation & Basic Operations
- SciPy - Matrix LU Decomposition
- SciPy - Matrix QU Decomposition
- SciPy - Singular Value Decomposition
- SciPy - Cholesky Decomposition
- SciPy - Solving Linear Systems
- SciPy - Eigenvalues & Eigenvectors
- SciPy Image Processing
- SciPy - Ndimage
- SciPy - Reading & Writing Images
- SciPy - Image Transformation
- SciPy - Filtering & Edge Detection
- SciPy - Top Hat Filters
- SciPy - Morphological Filters
- SciPy - Low Pass Filters
- SciPy - High Pass Filters
- SciPy - Bilateral Filter
- SciPy - Median Filter
- SciPy - Non - Linear Filters in Image Processing
- SciPy - High Boost Filter
- SciPy - Laplacian Filter
- SciPy - Morphological Operations
- SciPy - Image Segmentation
- SciPy - Thresholding in Image Segmentation
- SciPy - Region-Based Segmentation
- SciPy - Connected Component Labeling
- SciPy Optimize
- SciPy - Optimize
- SciPy - Special Matrices & Functions
- SciPy - Unconstrained Optimization
- SciPy - Constrained Optimization
- SciPy - Matrix Norms
- SciPy - Sparse Matrix
- SciPy - Frobenius Norm
- SciPy - Spectral Norm
- SciPy Condition Numbers
- SciPy - Condition Numbers
- SciPy - Linear Least Squares
- SciPy - Non-Linear Least Squares
- SciPy - Finding Roots of Scalar Functions
- SciPy - Finding Roots of Multivariate Functions
- SciPy - Signal Processing
- SciPy - Signal Filtering & Smoothing
- SciPy - Short-Time Fourier Transform
- SciPy - Wavelet Transform
- SciPy - Continuous Wavelet Transform
- SciPy - Discrete Wavelet Transform
- SciPy - Wavelet Packet Transform
- SciPy - Multi-Resolution Analysis
- SciPy - Stationary Wavelet Transform
- SciPy - Statistical Functions
- SciPy - Stats
- SciPy - Descriptive Statistics
- SciPy - Continuous Probability Distributions
- SciPy - Discrete Probability Distributions
- SciPy - Statistical Tests & Inference
- SciPy - Generating Random Samples
- SciPy - Kaplan-Meier Estimator Survival Analysis
- SciPy - Cox Proportional Hazards Model Survival Analysis
- SciPy Spatial Data
- SciPy - Spatial
- SciPy - Special Functions
- SciPy - Special Package
- SciPy Advanced Topics
- SciPy - CSGraph
- SciPy - ODR
- SciPy Useful Resources
- SciPy - Reference
- SciPy - Quick Guide
- SciPy - Cheatsheet
- SciPy - Useful Resources
- SciPy - Discussion
SciPy - Interpolate
Interpolation is a fundamental mathematical and computational technique used to estimate unknown values within the range of a set of known data points. Essentially it constructs a function that passes through or near the known points by allowing us to predict intermediate values where data is missing or sparse. It is widely used in areas like data analysis, signal processing, computer graphics and numerical simulations.
The SciPy library provides a comprehensive set of tools for interpolation through its scipy.interpolate module. This module includes methods for 1-dimensional, multi-dimensional and spline interpolation by offering a wide range of algorithms to suit different types of data and smoothness requirements.
Key Types of Interpolation in SciPy
SciPy provides a variety of interpolation methods for different kinds of data and applications. Below are the key types of interpolation available in the scipy.interpolate module −
- 1-Dimensional Interpolation: It allows for estimating unknown values based on known data points along a single variable. The scipy.interpolate module provides various functions for performing 1D interpolation by accommodating different data characteristics and requirements.
-
Cubic Spline Interpolation: It is a powerful interpolation technique where the interpolating function is a piecewise cubic polynomial. It ensures smoothness at the data points by creating a series of cubic polynomials that connect the given data points smoothly with continuous first and second derivatives across intervals.
SciPys CubicSpline function enables this interpolation by producing smooth curves for data points with no sharp bends or breaks. Its widely used in scientific computing, data fitting and graphics because of its ability to create visually appealing curves.
-
Barycentric Interpolation: This is an efficient form of polynomial interpolation where the interpolation polynomial is represented in terms of barycentric weights. It offers a numerically stable and efficient way to perform polynomial interpolation, especially when compared to methods like Lagrange interpolation.
The idea of this interpolation is to interpolate a set of given points by finding a polynomial that passes through them. The Lagrange interpolation which is computationally expensive and prone to numerical instability where barycentric interpolation is more stable and faster particularly for large datasets.
-
Piecewise Polynomial Interpolation: This interpolation divides a functions domain into multiple sub-intervals and fits a separate polynomial in each of these intervals. This technique ensures that the interpolated function can follow the local behavior of the data more closely compared to a single global polynomial. Piecewise interpolation methods often provide better accuracy especially for functions that exhibit significant changes in behavior across different regions.
A common form of piecewise interpolation is spline interpolation particularly cubic spline interpolation, where third-degree polynomials are fitted between each pair of adjacent data points.
-
Multivariate Interpolation: It is a generalization of interpolation to functions of multiple variables. Unlike univariate interpolation which involves a single independent variable where multivariate interpolation deals with multiple independent variables by making it essential for applications in higher-dimensional spaces. This technique is used when we want to approximate or estimate a function based on known values at specific points (data points) in multiple dimensions.
In multivariate interpolation the challenge is fitting a surface or higher-dimensional analog through the given data points.
Nearest Neighbor Interpolation: This is a simple and fast interpolation method where the value of an unknown data point is estimated as the value of the nearest known data point. This method is most commonly used when speed is more critical than accuracy or when working with discrete data.
Applications of Interpolation
Interpolation is a crucial technique in various fields by allowing users to estimate unknown values based on known data points. SciPy provides powerful tools for interpolation by enabling users to apply these techniques across diverse applications. Here are some key applications of interpolation in SciPy −
- Data Resampling: Interpolation is frequently employed to resample data, especially in time-series analysis. When dealing with irregularly spaced data points, interpolation aids in creating a regular grid, simplifying the analysis of trends and patterns.
- Image Processing: In image processing the interpolation methods are applied for resizing and transforming images. Techniques such as aside bilinear and bicubic interpolation facilitate smoother transitions when increasing or decreasing image sizes.
- Numerical Solutions to Differential Equations: Interpolation can be utilized within numerical methods to solve ordinary and partial differential equations. By estimating values at discrete points it helps create smooth solutions for problems like heat distribution and wave propagation.
- Signal Processing: In signal processing the interpolation is used to reconstruct signals from sampled data. It enhances the quality of audio and video signals by estimating values between sampled points.
- Scientific Data Analysis: Researchers often gather data at discrete intervals. Interpolation can fill gaps in experimental data by allowing for better visualization and analysis of trends.
- Geographic Information Systems (GIS): In GIS applications interpolation techniques estimate values at unsampled locations based on available geographic data. This is essential for creating contour maps and analyzing spatial information.
- Engineering and Manufacturing: Interpolation is applied in engineering simulations and manufacturing to estimate material and component properties based on discrete measurements.
- Financial Modeling: In finance the interpolation helps to estimate asset prices and yields based on existing market data. It is beneficial for pricing derivatives and managing risk.
Limitations of Interpolation in SciPy
While interpolation in SciPy offers powerful tools for estimating values between known data points it has several limitations and challenges that users must be aware of as mentioned below −
- Accuracy Dependent on Data Distribution: Interpolation assumes that the function between data points behaves smoothly. If the actual data is noisy, sparse or highly irregular so the interpolation may lead to inaccurate or misleading results.
- Overfitting in Higher-Degree Interpolation: Using higher-degree polynomial interpolation such as cubic splines,can sometimes result in overfitting where the interpolated curve oscillates excessively between data points especially when dealing with noisy data or a large number of points. This phenomenon is often referred to as Runge's phenomenon.
- Limited to Within Known Data Range: Standard interpolation methods such as linear and cubic splines are limited to interpolating values within the range of the known data points (extrapolation is often unreliable). Beyond the known range, the accuracy of the results can drop significantly and the behavior of the function becomes unpredictable.
- Sensitive to Outliers: If the dataset contains outliers or sudden spikes then interpolation methods may generate distorted results. The presence of such anomalies can lead to incorrect interpolated values as interpolation techniques are generally designed to work on smooth and continuous data.
- High Computational Cost for Large Data Sets: Interpolation methods particularly spline interpolation can become computationally expensive when applied to very large datasets. The complexity increases as more points are added especially for higher-dimensional interpolation which can lead to longer processing times.
- Dimensionality Challenges: In high-dimensional spaces such as 3D or 4D, the complexity of interpolation grows significantly. Managing multi-dimensional interpolation in SciPy like with griddata can be slow and often suffers from poor accuracy especially in sparse datasets.
- Boundary Artifacts: Interpolation methods such as cubic splines or other splines may show artifacts near the boundaries of the data where there are fewer points to influence the curve. These boundary effects can lead to inaccurate interpolated values near the edges of the dataset.
- Not Suitable for Discontinuous Functions: Interpolation methods assume smooth transitions between data points by making them unsuitable for discontinuous functions. In cases where there are sudden jumps or breaks in the data interpolation may fail to provide meaningful estimates.
- Extrapolation Risks: While interpolation is designed to work between known data points some users may attempt to use interpolation functions for extrapolation. However most interpolation methods in SciPy are unreliable for extrapolating beyond the original data range by leading to large errors or unpredictable results.
- Data Requirements: Some interpolation methods such as spline interpolation require a minimum number of data points to work properly. If the dataset is too small or if data points are unevenly spaced then the interpolation might not work as expected.
Univariate Interpolation Functions
These functions are used for performing univariate interpolation, allowing the estimation of values between known data points.
| S.No | Function & Description |
|---|---|
| 1 |
scipy.interpolate.interp1d() Interpolate a 1-D function based on input data points. |
| 2 |
scipy.interpolate.BarycentricInterpolator() Interpolating polynomial for a set of points using Barycentric formulation. |
| 3 |
scipy.interpolate.KroghInterpolator() Interpolating polynomial for a set of points using Krogh's method. |
| 4 |
scipy.interpolate.barycentric_interpolate() Convenience function for polynomial interpolation using Barycentric formulation. |
| 5 |
scipy.interpolate.krogh_interpolate() Convenience function for polynomial interpolation using Krogh's method. |
| 6 |
scipy.interpolate.pchip_interpolate() Convenience function for PCHIP (Piecewise Cubic Hermite Interpolating Polynomial) interpolation. |
| 7 |
scipy.interpolate.CubicHermiteSpline() Piecewise-cubic interpolator that matches values and first derivatives at given points. |
| 8 |
scipy.interpolate.PchipInterpolator() PCHIP 1-D monotonic cubic interpolation ensuring monotonicity. |
| 9 |
scipy.interpolate.Akima1DInterpolator() Akima interpolator, which is a non-smoothing spline interpolation. |
| 10 |
scipy.interpolate.CubicSpline() Cubic spline data interpolator, providing smooth piecewise cubic polynomial interpolants. |
| 11 |
scipy.interpolate.PPoly() Piecewise polynomial interpolator defined in terms of coefficients and breakpoints. |
| 12 |
scipy.interpolate.BPoly() Piecewise polynomial interpolator defined in terms of coefficients and breakpoints (generalized). |
Multi-variant Interpolation Functions
These functions are used for performing interpolation on unstructured and structured N-dimensional data by enabling the estimation of values in multi-dimensional space.
| S.No | Function & Description |
|---|---|
| 1 |
scipy.interpolate.griddata() Interpolate unstructured D-D data based on the specified method (linear, nearest, cubic). |
| 2 |
scipy.interpolate.LinearNDInterpolator() Piecewise linear interpolator for N dimensions, using the input points and values. |
| 3 |
scipy.interpolate.NearestNDInterpolator() Nearest-neighbor interpolation for N-D data, finding the nearest point in the input data. |
| 4 |
scipy.interpolate.CloughTocher2DInterpolator() Interpolates over a 2D domain using Clough-Tocher method, allowing for piecewise polynomial fitting. |
| 5 |
scipy.interpolate.RBFInterpolator() Radial basis function (RBF) interpolation in N dimensions for smooth surface fitting. |
| 6 |
scipy.interpolate.Rbf() Radial basis function interpolator for multi-dimensional data, allowing for flexible interpolation methods. |
| 7 |
scipy.interpolate.interpn() Multidimensional interpolation on regular or rectilinear grids, providing flexibility in interpolation methods. |
| 8 |
scipy.interpolate.RegularGridInterpolator() Interpolator on a regular or rectilinear grid in arbitrary dimensions, enabling efficient interpolation on structured grids. |
| 9 |
scipy.interpolate.RectBivariateSpline() Piecewise spline interpolation for 2D data defined on a rectangular grid. |
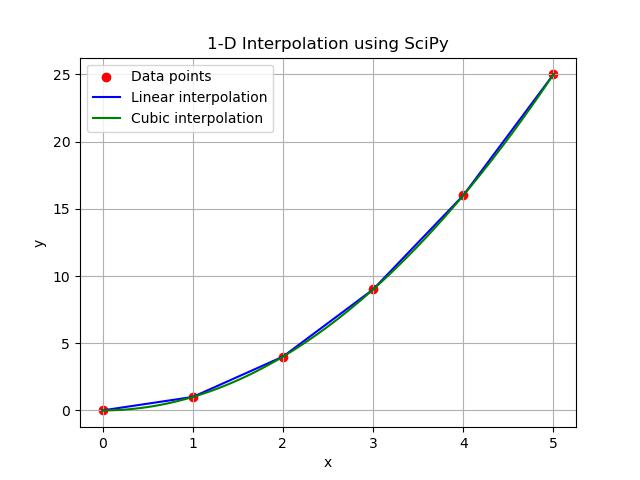
Example
Heres an example of 1-D interpolation using SciPys interp1d() function. This example shows how to interpolate between a set of data points and plot the results −
import numpy as np
import matplotlib.pyplot as plt
from scipy.interpolate import interp1d

# Given data points
x = np.array([0, 1, 2, 3, 4, 5])
y = np.array([0, 1, 4, 9, 16, 25])

# Create linear and cubic interpolation functions
linear_interp = interp1d(x, y, kind='linear')
cubic_interp = interp1d(x, y, kind='cubic')

# Generate new x values for interpolation
x_new = np.linspace(0, 5, 100)

# Interpolate the y values at the new x values
y_linear = linear_interp(x_new)
y_cubic = cubic_interp(x_new)

# Plot the original data points
plt.scatter(x, y, color='red', label='Data points')

# Plot the linear interpolation
plt.plot(x_new, y_linear, label='Linear interpolation', color='blue')

# Plot the cubic interpolation
plt.plot(x_new, y_cubic, label='Cubic interpolation', color='green')

# Adding labels and legend
plt.title('1-D Interpolation using SciPy')
plt.xlabel('x')
plt.ylabel('y')
plt.legend()
plt.grid(True)

# Display the plot
plt.show()
Here is the output of the Interpolate example in scipy −