- SciPy - Home
- SciPy - Introduction
- SciPy - Environment Setup
- SciPy - Basic Functionality
- SciPy - Relationship with NumPy
- SciPy Clusters
- SciPy - Clusters
- SciPy - Hierarchical Clustering
- SciPy - K-means Clustering
- SciPy - Distance Metrics
- SciPy Constants
- SciPy - Constants
- SciPy - Mathematical Constants
- SciPy - Physical Constants
- SciPy - Unit Conversion
- SciPy - Astronomical Constants
- SciPy - Fourier Transforms
- SciPy - FFTpack
- SciPy - Discrete Fourier Transform (DFT)
- SciPy - Fast Fourier Transform (FFT)
- SciPy Integration Equations
- SciPy - Integrate Module
- SciPy - Single Integration
- SciPy - Double Integration
- SciPy - Triple Integration
- SciPy - Multiple Integration
- SciPy Differential Equations
- SciPy - Differential Equations
- SciPy - Integration of Stochastic Differential Equations
- SciPy - Integration of Ordinary Differential Equations
- SciPy - Discontinuous Functions
- SciPy - Oscillatory Functions
- SciPy - Partial Differential Equations
- SciPy Interpolation
- SciPy - Interpolate
- SciPy - Linear 1-D Interpolation
- SciPy - Polynomial 1-D Interpolation
- SciPy - Spline 1-D Interpolation
- SciPy - Grid Data Multi-Dimensional Interpolation
- SciPy - RBF Multi-Dimensional Interpolation
- SciPy - Polynomial & Spline Interpolation
- SciPy Curve Fitting
- SciPy - Curve Fitting
- SciPy - Linear Curve Fitting
- SciPy - Non-Linear Curve Fitting
- SciPy - Input & Output
- SciPy - Input & Output
- SciPy - Reading & Writing Files
- SciPy - Working with Different File Formats
- SciPy - Efficient Data Storage with HDF5
- SciPy - Data Serialization
- SciPy Linear Algebra
- SciPy - Linalg
- SciPy - Matrix Creation & Basic Operations
- SciPy - Matrix LU Decomposition
- SciPy - Matrix QU Decomposition
- SciPy - Singular Value Decomposition
- SciPy - Cholesky Decomposition
- SciPy - Solving Linear Systems
- SciPy - Eigenvalues & Eigenvectors
- SciPy Image Processing
- SciPy - Ndimage
- SciPy - Reading & Writing Images
- SciPy - Image Transformation
- SciPy - Filtering & Edge Detection
- SciPy - Top Hat Filters
- SciPy - Morphological Filters
- SciPy - Low Pass Filters
- SciPy - High Pass Filters
- SciPy - Bilateral Filter
- SciPy - Median Filter
- SciPy - Non - Linear Filters in Image Processing
- SciPy - High Boost Filter
- SciPy - Laplacian Filter
- SciPy - Morphological Operations
- SciPy - Image Segmentation
- SciPy - Thresholding in Image Segmentation
- SciPy - Region-Based Segmentation
- SciPy - Connected Component Labeling
- SciPy Optimize
- SciPy - Optimize
- SciPy - Special Matrices & Functions
- SciPy - Unconstrained Optimization
- SciPy - Constrained Optimization
- SciPy - Matrix Norms
- SciPy - Sparse Matrix
- SciPy - Frobenius Norm
- SciPy - Spectral Norm
- SciPy Condition Numbers
- SciPy - Condition Numbers
- SciPy - Linear Least Squares
- SciPy - Non-Linear Least Squares
- SciPy - Finding Roots of Scalar Functions
- SciPy - Finding Roots of Multivariate Functions
- SciPy - Signal Processing
- SciPy - Signal Filtering & Smoothing
- SciPy - Short-Time Fourier Transform
- SciPy - Wavelet Transform
- SciPy - Continuous Wavelet Transform
- SciPy - Discrete Wavelet Transform
- SciPy - Wavelet Packet Transform
- SciPy - Multi-Resolution Analysis
- SciPy - Stationary Wavelet Transform
- SciPy - Statistical Functions
- SciPy - Stats
- SciPy - Descriptive Statistics
- SciPy - Continuous Probability Distributions
- SciPy - Discrete Probability Distributions
- SciPy - Statistical Tests & Inference
- SciPy - Generating Random Samples
- SciPy - Kaplan-Meier Estimator Survival Analysis
- SciPy - Cox Proportional Hazards Model Survival Analysis
- SciPy Spatial Data
- SciPy - Spatial
- SciPy - Special Functions
- SciPy - Special Package
- SciPy Advanced Topics
- SciPy - CSGraph
- SciPy - ODR
- SciPy Useful Resources
- SciPy - Reference
- SciPy - Quick Guide
- SciPy - Cheatsheet
- SciPy - Useful Resources
- SciPy - Discussion
SciPy - Kaplan-Meier Estimator Survival Analysis
The Kaplan-Meier estimator is a statistical method used to estimate the probability of survival over time, especially when dealing with censored data, where some subjects' event times are unknown due to loss of follow-up. Its commonly applied in survival analysis in medical research, reliability engineering and other fields.
SciPy doesn't directly implement the Kaplan-Meier estimator but we can use Python's lifelines library to perform the estimation and visualize the survival function. Below is an explanation of the Kaplan-Meier method and how we can apply it.
Basics of Kaplan-Meier Estimator
The Kaplan-Meier estimator calculates the survival function which represents the probability that a subject survives past a given time. It does so by considering both observed event times and censored data points i.e., when an event hasn't occurred but the subject is lost to follow-up.
The estimator is defined by a step-function curve that steps down each time an event occurs. The survival probability decreases when a failure or event happens and stays flat between events.
Implementation Using lifelines library
Though the SciPy library provides robust numerical and statistical functions, for survival analysis like Kaplan-Meier, lifelines is more efficient and designed specifically for this purpose. Heres how we can implement the Kaplan-Meier estimator using lifelines library−
Install lifelines
First we need to install the lifelines library with the help of command prompt by using the below command −
pip install lifelines
Manual Implementation of the Kaplan-Meier Estimator
The Kaplan-Meier estimator is used to estimate the survival function from lifetime data. It is commonly used in survival analysis and is a non-parametric method to estimate the probability of survival over time.
Heres how we can compute the Kaplan-Meier estimator using Python, without any external library but optionally using lifelines for simplicity −
import numpy as np
import pandas as pd

# Define function to compute Kaplan-Meier estimator
def kaplan_meier_estimator(event_times, events_observed):
    # Sort the event times
    event_times_sorted = np.sort(event_times)

    # Initialize the number at risk (initially everyone is at risk)
    n_risk = len(event_times_sorted)

    # Initialize the survival probabilities
    survival_probs = []
    previous_survival_prob = 1.0

    # Iterate through the event times to calculate survival probabilities
    for time in event_times_sorted:
        # Number of events at this time (number of deaths)
        deaths = np.sum((event_times == time) & (events_observed == 1))

        # Number of individuals at risk just before this time
        risk_set = np.sum(event_times >= time)

        # Update the survival probability
        survival_prob = previous_survival_prob * (1 - deaths / risk_set)
        survival_probs.append(survival_prob)

        # Update previous survival probability
        previous_survival_prob = survival_prob

    # Create a DataFrame for the Kaplan-Meier estimate
    km_df = pd.DataFrame({
        'Event Time': event_times_sorted,
        'Survival Probability': survival_probs
    })

    return km_df

# Example Data
event_times = np.array([5, 6, 6, 2, 4, 3, 8, 10, 7])  # Time to event (or censoring)
events_observed = np.array([1, 1, 0, 1, 0, 1, 1, 0, 1])  # 1 = event observed, 0 = censored

# Compute the Kaplan-Meier estimator
km_df = kaplan_meier_estimator(event_times, events_observed)

print(km_df)
Following is the output of the manual implementation of the Kaplan-Meier estimator without using the lifelines library −
  Event Time  Survival Probability
0           2              0.888889
1           3              0.777778
2           4              0.777778
3           5              0.648148
4           6              0.518519
5           6              0.414815
6           7              0.276543
7           8              0.138272
8          10              0.138272
Using lifelines library
If we want to use a more straightforward library to compute the Kaplan-Meier estimator, we can use the lifelines library which we installed before −
from lifelines import KaplanMeierFitter
import numpy as np

# Example Data
event_times = np.array([5, 6, 6, 2, 4, 3, 8, 10, 7])  # Time to event (or censoring)
events_observed = np.array([1, 1, 0, 1, 0, 1, 1, 0, 1])  # 1 = event observed, 0 = censored

# Instantiate the KaplanMeierFitter
kmf = KaplanMeierFitter()

# Fit the model to the data
kmf.fit(event_times, event_observed=events_observed)

# Plot the Kaplan-Meier estimator
kmf.plot()

# Display the survival probabilities at each time point
print(kmf.survival_function_)
Here is the output of the Kaplan-Meier estimator computed using the lifelines library −
     KM_estimate
timeline
0.0          1.000000
2.0          0.888889
3.0          0.777778
4.0          0.777778
5.0          0.648148
6.0          0.518519
7.0          0.345679
8.0          0.172840
10.0         0.172840
Customizing the Plot
After computing the Kaplan-Meier we can adjust the plot by customizing the title, labels and line style. For example we can change the color or make the line dashed to highlight different parts of the curve. Below is the code −
import numpy as np
from lifelines import KaplanMeierFitter
import matplotlib.pyplot as plt
# Example data: event times and censoring indicators
event_times = np.array([1, 2, 3, 4, 5, 6, 7, 8, 9])
censored = np.array([1, 1, 0, 1, 1, 0, 1, 1, 0]) # 1: event, 0: censored
# Initialize the Kaplan-Meier fitter
kmf = KaplanMeierFitter()
# Fit the model to the data
kmf.fit(event_times, event_observed=censored)
# Customize the Kaplan-Meier plot
kmf.plot_survival_function(color='blue', linestyle='-', label='Survival Curve')
# Adding titles and axis labels
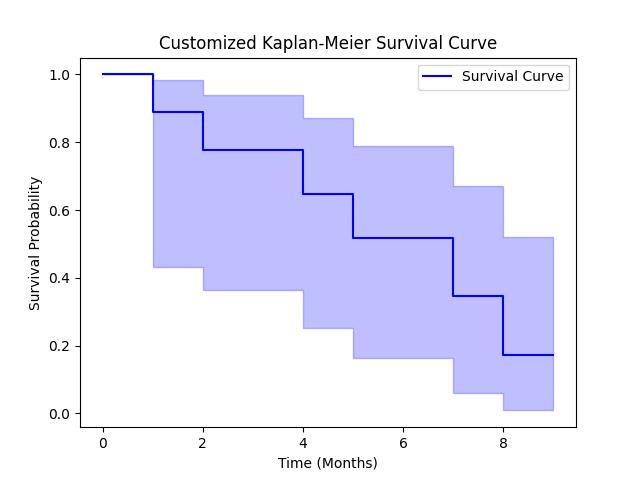
plt.title('Customized Kaplan-Meier Survival Curve')
plt.xlabel('Time (Months)')
plt.ylabel('Survival Probability')
# Display the plot
plt.show()
Following is the output of the Customized Kaplan-Meier estimator plot computed using the lifelines library −